
Ali Ahmed | Consultant Symbios, Information Systems & Supply Chain Specialist
![]() This email address is being protected from spambots. You need JavaScript enabled to view it.
This email address is being protected from spambots. You need JavaScript enabled to view it.
Regardless of your industry, almost everyone nowadays is at a position where they need to create a dashboard. Whether to monitor business performance, create actionable insights, or simply impress your boss; here are key aspects you should consider in your dashboard. Inspired by our #SymbiosDigital moto, simplify, smartify, speedify.
First #simplify your dashboard, how?
- Keep related metrics together, group them using color codes or/and borders
- When these metrics are repeated for different teams/divisions use the exact same grouping.
- Don't try to put everything on one page, use multiple pages for related metrics, and use whitespace.
- Again don't cram everything in one page and if using tables don't use a lot of columns, one or two should be sufficient one to show performance and one to give comparable insights. Keep it Simple.
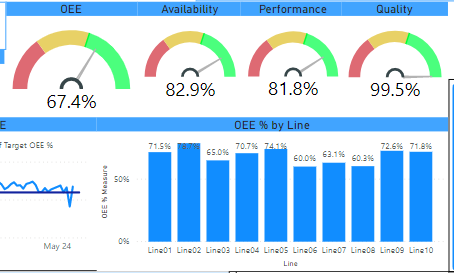
- Sometimes it can be smart to repeat the same metric in different visuals. For example, a speedometer showing current overall performance versus target, and a bar chart showing subdivisions performance. This helps keep it clear and simple.
The below image shows the repeating of KPI OEE, the speedometer shows it overall the plant, where the bar chart shows it broken down by lines.

Second #smartify your dashboard, how?
- To keep it smart use clearly visible visual size and text size. Keep in mind these can be placed on projectors or large screens. They must be clear. Think ahead.
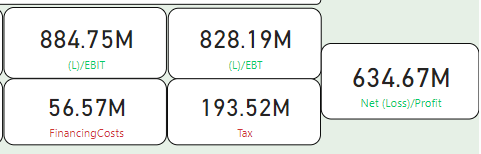
- Use thousands delimiter, separator to make easier to read, and when smart to use number abbreviations use them to avoid using up of so much space, such as K for thousand, M for million, B for billion, and so on
- In these visuals, we used the millions of abbreviation.
3. Also to keep it smart think reading style if your language starts from left to right then start your dashboard just like a book from top left and going to bottom right.
4. Smart way to organize your data is just like a grid, or table, where you place your visualizations and tables in equally sized cells in a grid. This gives the smartest and easiest follow through in your dashboard.
5. Think smart, research visualization types before starting to choose your visualization. Time series, proportions, ranking, etc.
Thirdly #speedify your dashboard insights, how?
- Goes without saying using visuals instead of tables speedifies your dashboard. Use them wisely.
- Use conditional formatting with traffic light color codes. This helps generate quick insights.
- For simple users to state everything clearly, don't use drilling features. This will help limit and speedify interactions, and insights.
- Define the role of your dashboard if operational make it more decision-oriented and real-time if the analytical focus on historical data and insights.
- When possible add a spice of gamification to your dashboard by creating leaderboards and symbolic badges. Speeding up the usability of your dashboard.
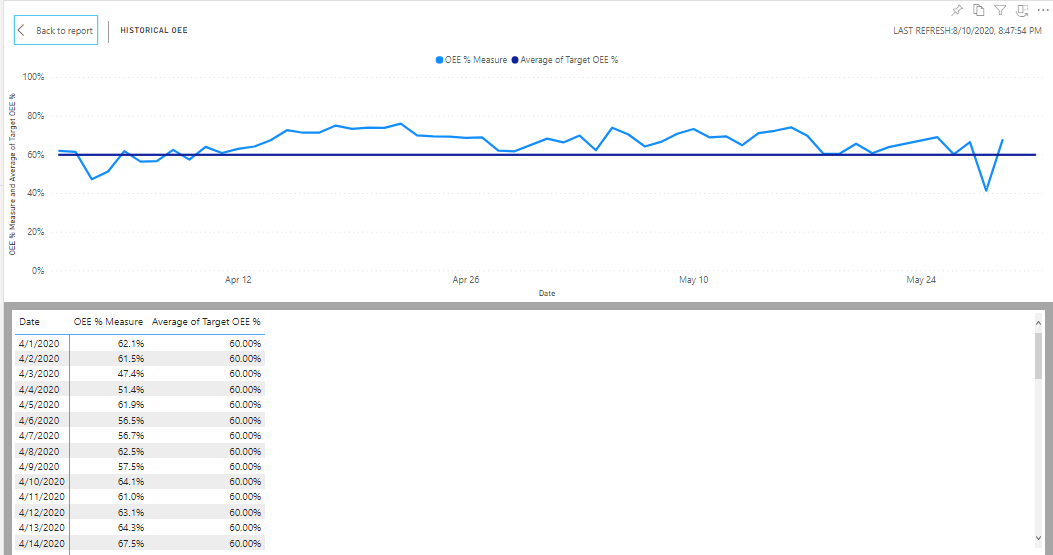
In this example, we see the difference and speed of using a line chart rather than viewing the data in a table.
View it on Symbios Digital Website
Sources:
- https://www.plecto.com/blog/dashboard-design/golden-rules-dashboard-design/?utm_source=googleads&utm_medium=ads&utm_campaign=INT-GA-C-Plecto_DSA_Promotion-A-ANY-M-WW&utm_content=DSA&gclid=Cj0KCQjwvb75BRD1ARIsAP6LcqtMlgHcVEBYZDxMD-BQEgd5C5AKJdzzJYkW5YQK1sAoSHZQTjWWtmwaAnIBEALw_wcB
- https://medium.muz.li/10-rules-of-dashboard-design-f1a4123028a2
- https://www.sqlbi.com/wp-content/uploads/videotrainings/dashboarddesign/rules-A3.pdf
- https://dashthis.com/blog/the-7-golden-rules-to-creating-kickass-dashboards/
