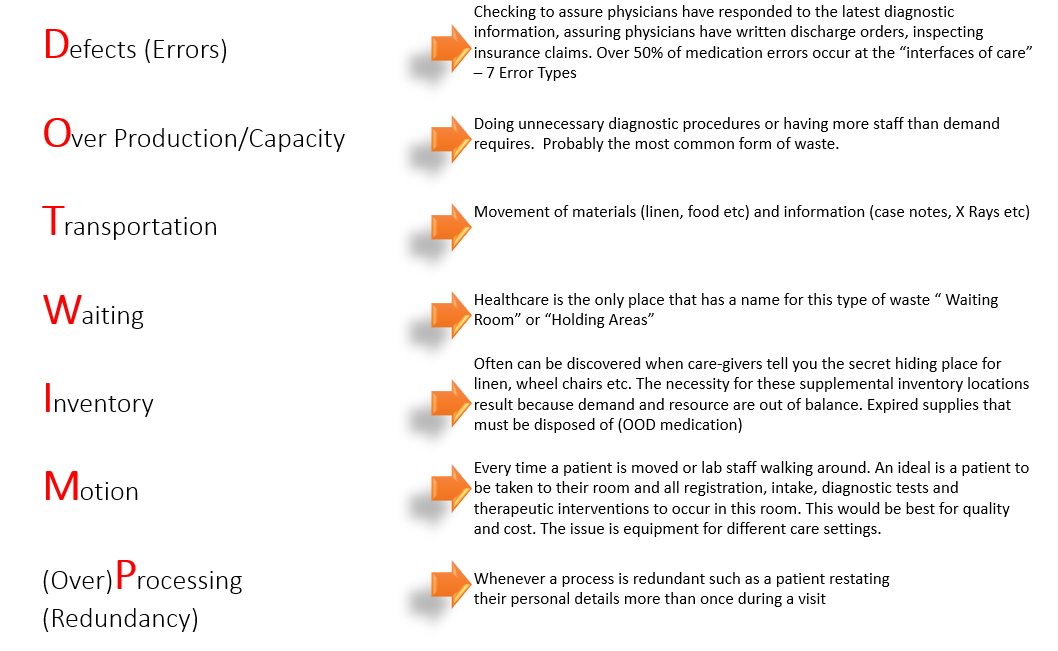
How Do We See Poor Processes?
Defects (Errors): Checking to assure physicians have responded to the latest diagnostic information, assuring physicians have written discharge orders, inspecting insurance claims. Over 50% of medication errors occur at the “interfaces of care” – 7 Error Types
Over Production/Capacity: Doing unnecessary diagnostic procedures or having more staff than demand requires. Probably the most common form of waste.
Transportation: Movement of materials (linen, food, etc) and information (case notes, X Rays, etc)
Waiting: Healthcare is the only place that has a name for this type of waste “ Waiting Room” or “Holding Areas”
Inventory: Often can be discovered when caregivers tell you the secret hiding place for linen, wheelchairs, etc. The necessity for these supplemental inventory locations results because demand and resources are out of balance. Expired supplies that must be disposed of (OOD medication)
Motion: Every time a patient is moved or lab staff walking around. An ideal is a patient to be taken to their room and all registration, intake, diagnostic tests, and therapeutic interventions to occur in this room. This would be best for quality and cost. The issue is equipment for different care settings.
(Over)Processing (Redundancy): Whenever a process is redundant such as a patient restating their personal details more than once during a visit
Put Another Way in Hospital Departments
| Departement | Role | VA | NVA |
| Operating Room | Surgeon | Operating on Patient | Waiting for a delayed procedure or performing unnecessary steps |
| Pharmacy | Technician | Creating an Intravenous Formula | Reprocessing medications that were returned from patient units |
| Inpatient Unit | Nurse | Administering medications to patient | Copying information from one computer system to another |
| Radiology | Technician | Performing MRI procedure | Performing a medically unnecessary scan |
| Laboratory | Technologist | Interpreting a test result | Fixing a broken instrument |
Value Add (VA) vs. Non-Value Add (NVA)
| Departement | Role | VA | NVA |
| Emergency Department | Patient | Being evaluated or treated | Waiting to be seen |
| Clinical Laboratory | Patient Specimen | Being centrifuged or tested | Waiting to be moved as a batch |
| Pharmacy | Prescription | Medication being formulated or prepared | Being inspected multiple times |
| Perioperative Services (time before, during, after) | Sterilized Instruments | The time when instruments are being sterilized | Instruments being sterilized repeatedly without ever being used from a standard kit |
| Nutrition Services | Patient Food Tray | The time when food is being cooked or tray is being assembled | Being reworked because the tray was prepared incorrectly |
Do We really need Lean?
Let's look at an example of a patient journey for outpatient surgery (A patient who is admitted to a hospital or clinic for treatment that does not require an overnight stay)
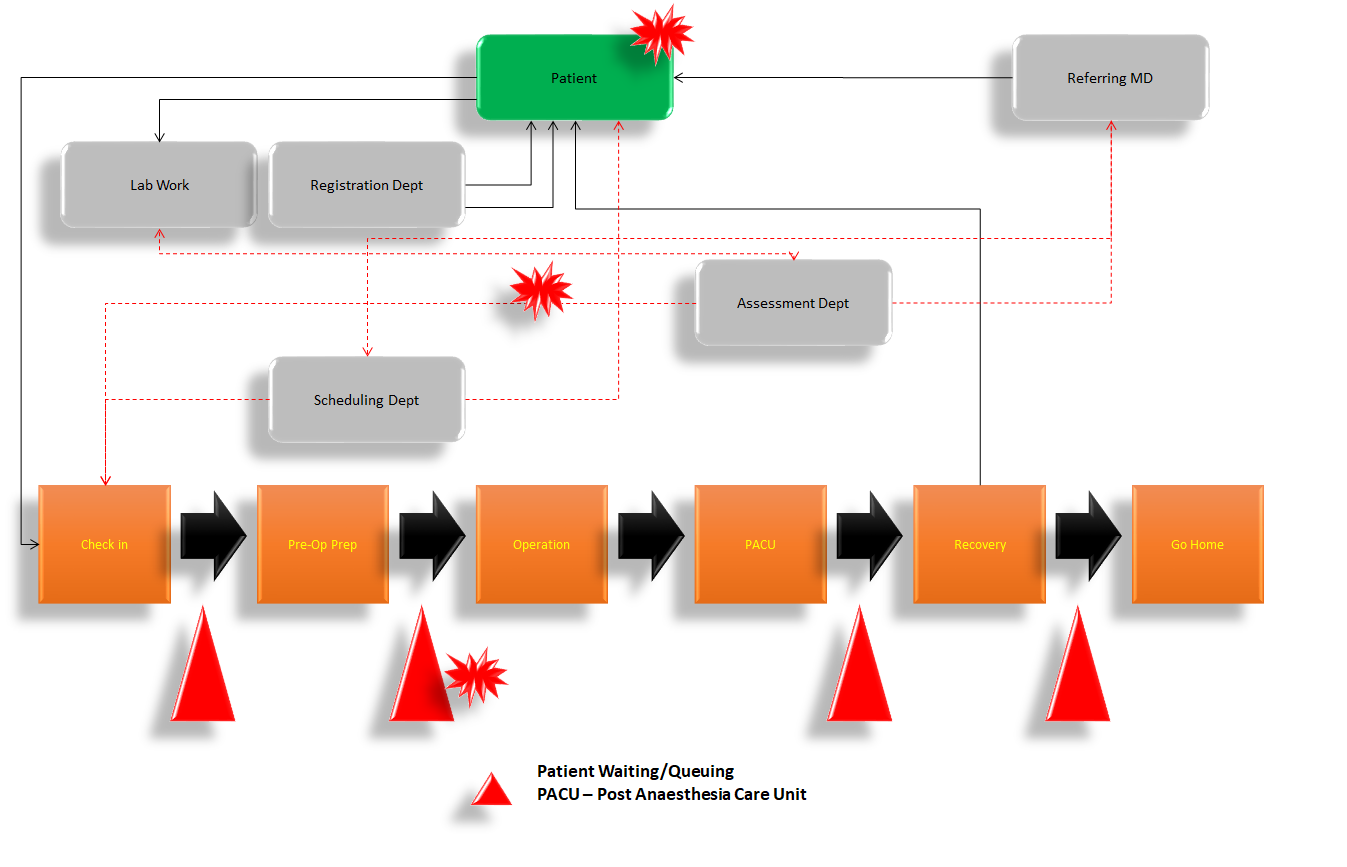
Do We really need Lean?
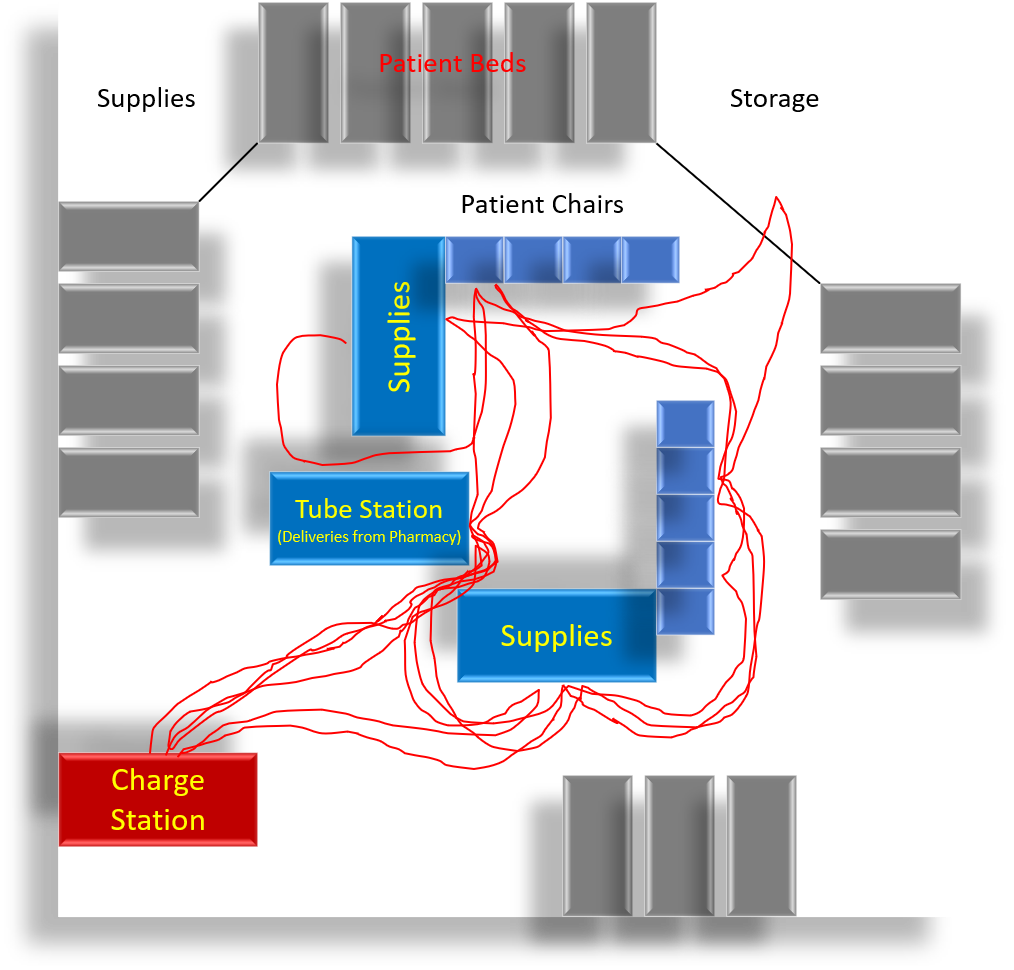
A nurse walked 1825 feet in 50 minutes, a pace of more than 4 miles per day (A Chemotherapy Unit).
32% of the nurse's time was spent walking.
30% of the time was spent on Value Add activities which were loosely defined as any time with direct patient contact.
Ideally, as patients arrive they are located close together but this is not always practical so they get whatever chair is available and any nurse who happens to be available.
Other issues include frequently attended Tube Station, Non-Standardised Medication Carts, and inconveniently located storage/supplies.
Do We really need Lean?
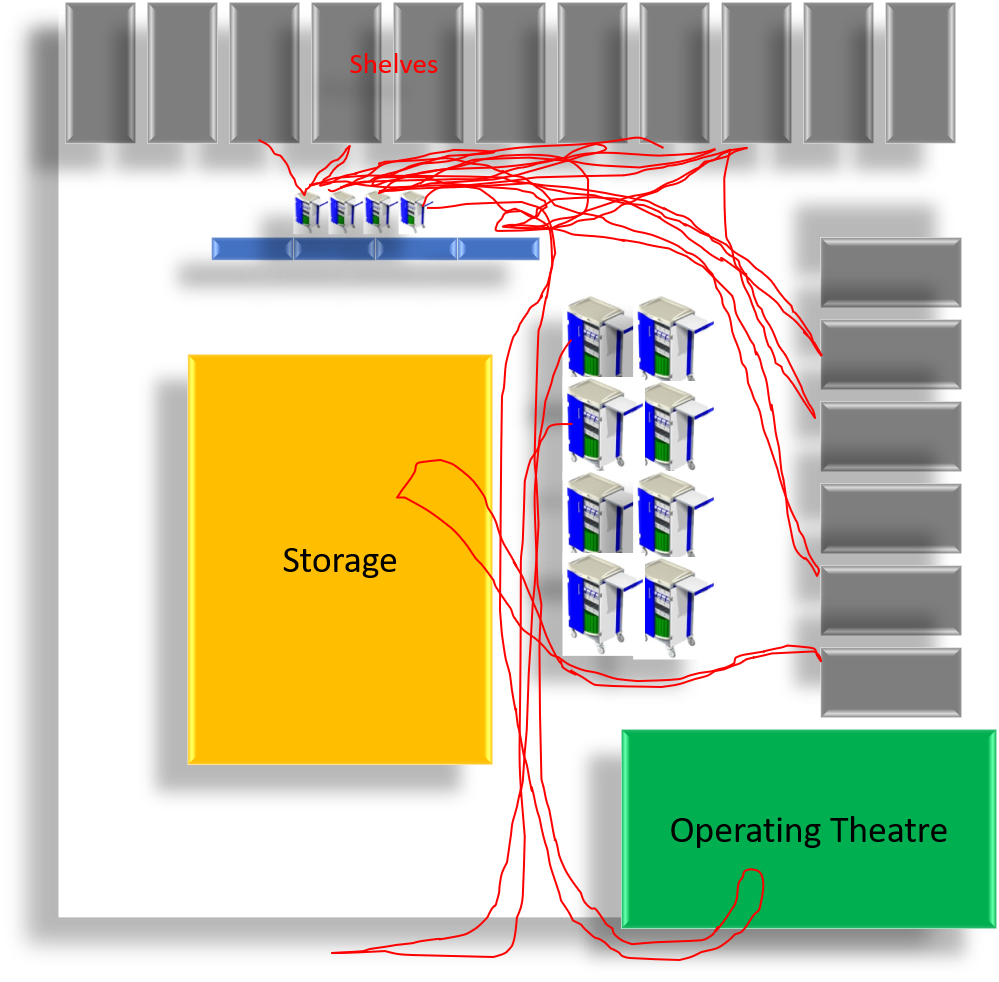
A perioperative services department, technicians, and nurses build case carts that are later rolled into the operating room for surgery.
In two observed cases, a technician and nurse walked more than 1000 feet to build each of their carts.
In two carts, 44% of the technicians and 36% of the burses time was walking.
Traditional Processes
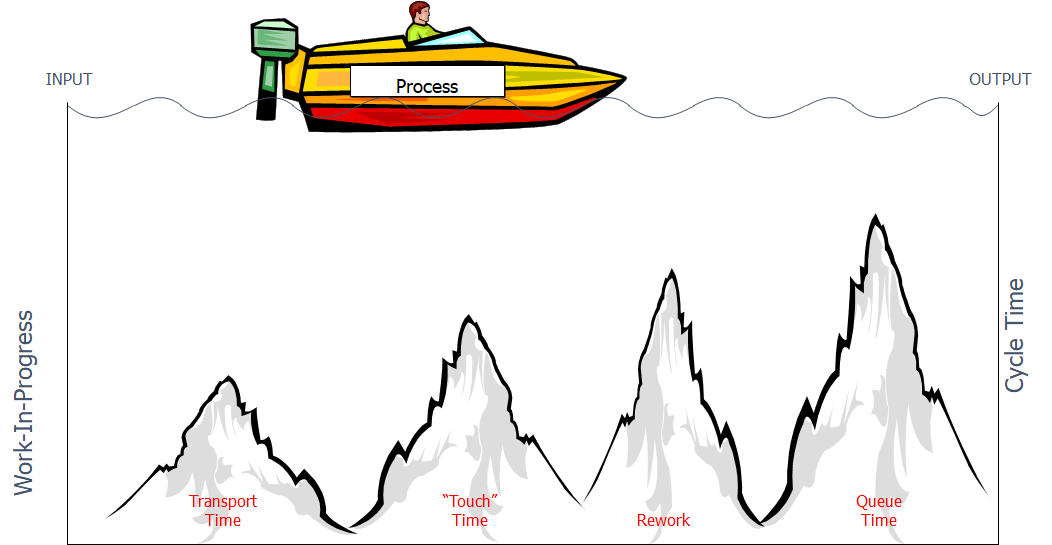
Lots of Stuff in Process = Long Cycle Times
Cycle Time = WIP / Exit Rate
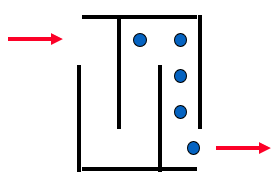
 Throughput Time = WIP/Exit Rate = 5 people/1 person /minute
Throughput Time = 5 minutes
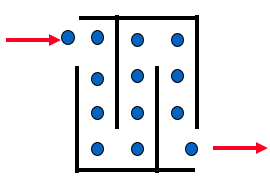
Throughput Time = WIP/Exit Rate = 13 people/1 person /minute
Throughput Time = 5 minutes
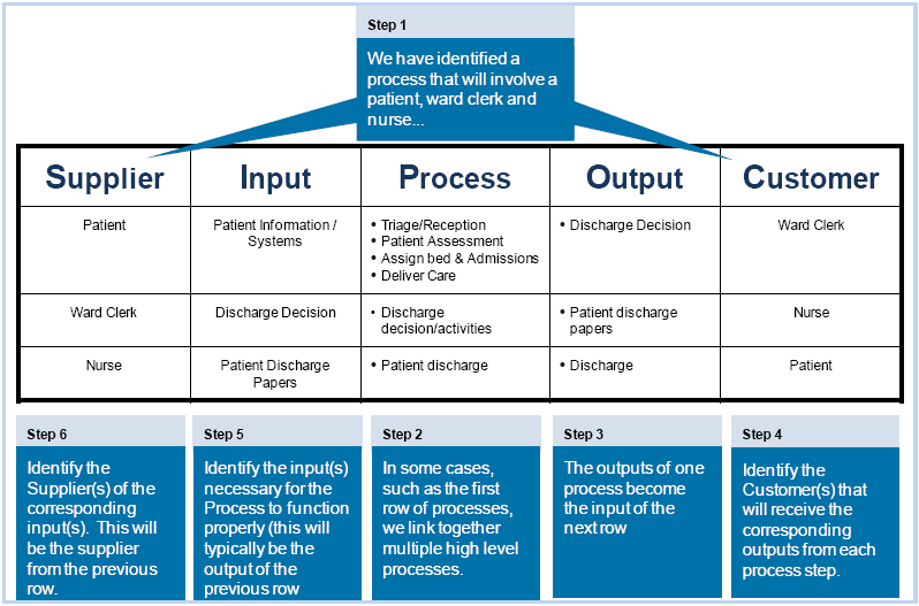
SIPOC
| Suppliers | Inputs | Process | Outputs | Customers |
|
|
|
|
|
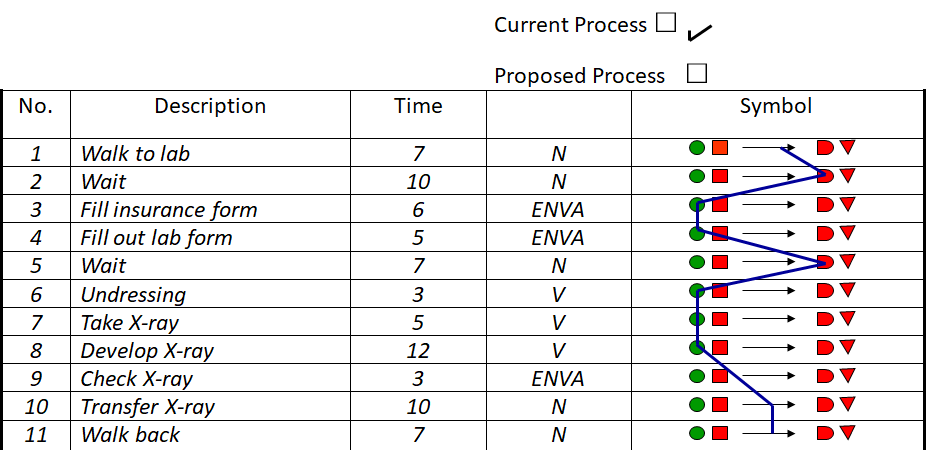
Example of a Process Activity Charts
Process Activity Chart Page: 1 of 1
Process: X-ray Date: 5/1/07
Developed by: Boulder Community Hospital
For each activity, fill in the required information. Also, connect the symbols to show the flow through the process.
The value code indicates whether the activity adds value (V), does not add value (N), or controls)